Case Study
30% faster processing across 6 locations, once they could see where time was lost.
DaVinci Micro Fulfillment | Multi-location | 6 warehouses

Average processing time decrease
Exception rate
Locations optimized
Processing was too slow. Nobody could pinpoint why.
DaVinci Micro Fulfillment operates 6 fulfillment centers. Orders were processing slower than they should have been, leadership knew that. Exception rates were running at 7.5%, well above acceptable levels. But identifying the root causes was a different problem entirely.
WMS reports showed what shipped and when. They showed order counts, throughput numbers, exception flags. What they couldn't show was why. Why was one station consistently slower than the others? Why were exception rates high on certain shifts? Why did processing times vary so much across locations running the same workflows?
The data gap wasn't in what the digital systems tracked. It was in what they couldn't see: the physical reality at each station. Time lost between orders. Operators improvising around unclear SOPs. Exceptions that triggered manual interventions with no visibility into how long those interventions actually took.
DaVinci had the numbers. They didn't have the context behind the numbers. And without that context, every improvement effort was guesswork.
Per-station activity data revealed exactly where time was wasted.
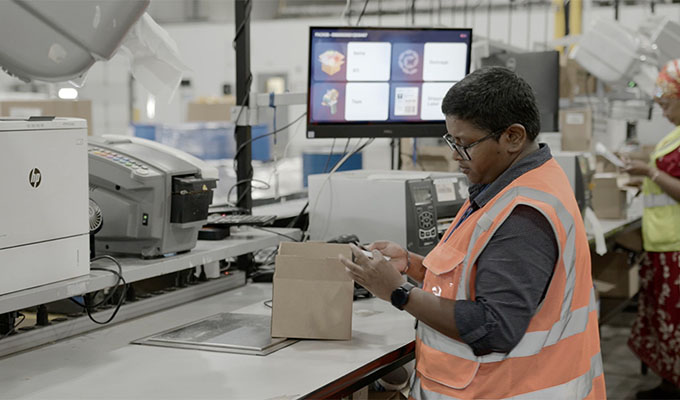
Rabot was deployed across all 6 DaVinci locations. Cameras at every station began capturing the physical activity of every order, not just what the WMS logged, but what actually happened during each packout.
For the first time, DaVinci could see the full picture. Per-station, per-operator activity data showed exactly where time was being lost: idle gaps between orders, excessive time on dunnage and packaging steps, stations waiting on exception resolution with no visibility upstream.
The data didn't just confirm what leadership suspected. It revealed problems they hadn't known existed. Specific stations were bottlenecks, not because of the operators, but because of the workflow design at those stations. Certain exception types were consuming disproportionate time across specific locations. The same SOP was being executed differently at different sites.
With that visibility, DaVinci's operations team made targeted changes. They restructured workflows at bottleneck stations. They automated steps that were consuming manual time. They standardized SOP execution across locations using Rabot's work instructions so that every operator, at every site, followed the same process.
The improvements weren't theoretical. They were specific, measurable, and driven by data that had never existed before.
The numbers across 6 locations.
Average processing time
Decrease across all locations
Exception rate
Dropped across locations
Locations optimized
Capacity utilization improved
Processing time reduction measured as an average across all 6 DaVinci locations. The 30% reduction reflects the combined impact of bottleneck identification, workflow restructuring, and standardized work instructions.
The exception rate improvement (7.5% to 2%) was observed and partially replicated. Results varied by site and by the specific nature of exceptions at each location.
"After installing Rabot, we were able to say 'look at how much time we're wasting on every order.' Rabot enabled us to give those areas attention and automate steps for a more seamless packout workflow."
Drake Meyer
VP Operations, DaVinci Micro Fulfillment
Performance. Prevention.
Performance
Run tighter every week.
DaVinci knew processing was slow but couldn't pinpoint why. Per-station activity data revealed exactly where time was wasted: idle gaps, exception bottlenecks, inconsistent workflows across locations. With that visibility, they restructured operations and cut processing time 30%.
Prevention
Stop errors before they ship.
Exception rates were running at 7.5% with no root-cause visibility. Rabot showed where and why exceptions were occurring, enabling targeted fixes. The rate dropped to 2%, and the team could see problems forming before they became costly.
See more results.
Manifest.eco
90% of dispute liability eliminated in 15 days.
90% liability eliminated
3PL | Growing operation
Brilliant Fulfillment
5X ROI in 2 months. New hire ramp-up from 13 days to 2.
5X ROI
3PL | Brand-focused
Staci Americas
71% error reduction, even with scan-verify in place.
71% error reduction
3PL | 25,000+ orders/day | 19 stations